
MXeval NEW RELEASE 4.0: Enter new Dimensions
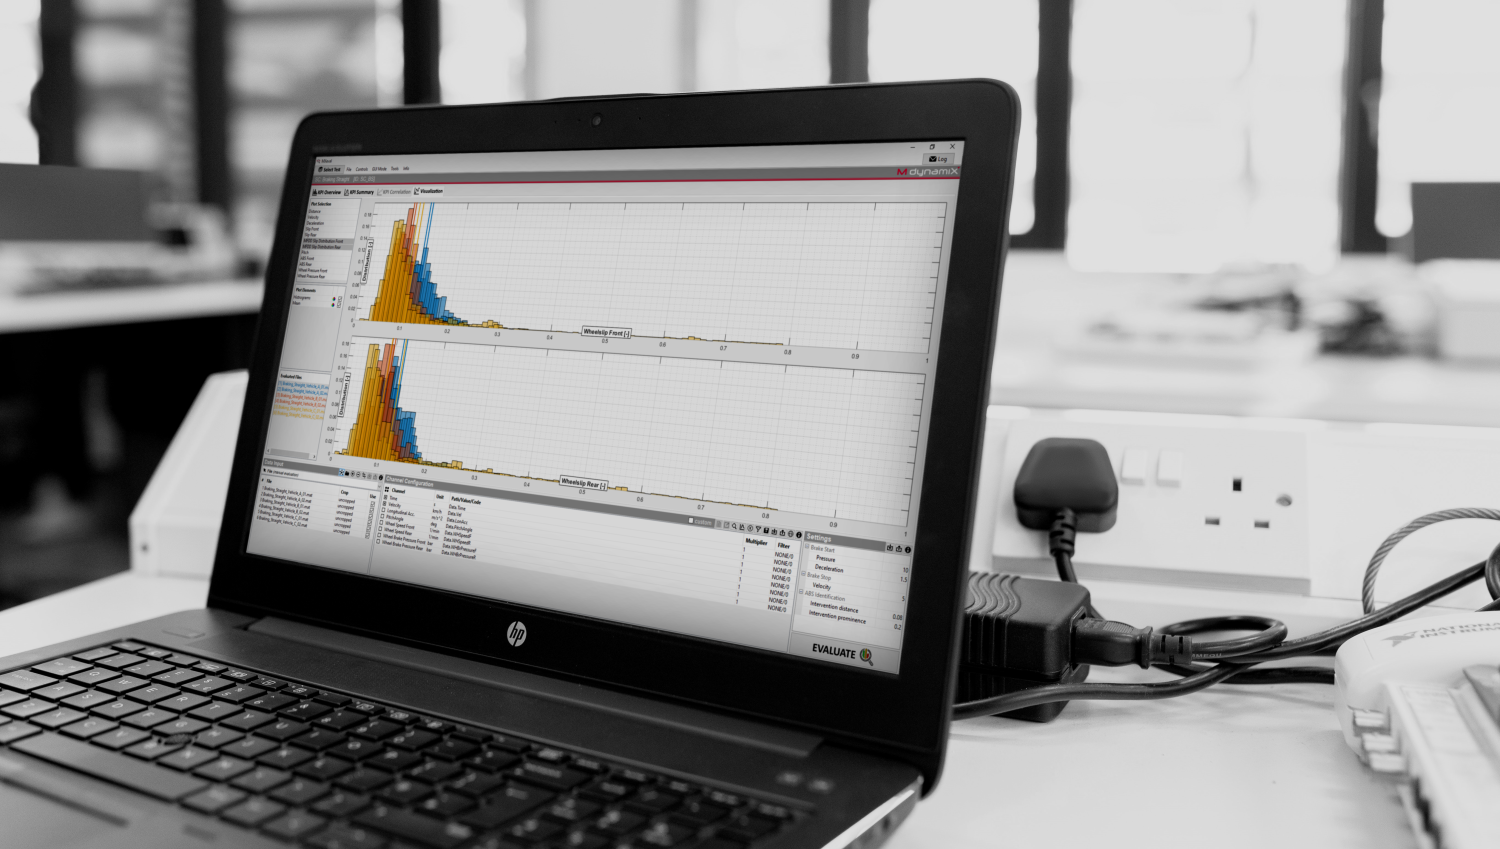
The continuous evolution of MXeval is opening up new dimensions in a wide variety. Own processing and ideas can be realized in the custom tests and are fully supported by the numerous features of the framework. Besides the features, the visualization has also received a major update – new dimensions with heatmap signals in a GPS plot with Google Maps background in subplots – everything is possible. ESC and brake experts are now also part of the MXeval universe, test the new Stability Control library!
This video of our Youtube playlist shows all features in less than three minutes:
 Stability Control Library
This new evaluation library contains various tests related to braking and dynamic stability control. For example the Straight Line Braking (with MFDD analysis) and µ-Split Braking tests for brake benchmarking or Sine With Dwell and Lane Change tests to analyze the lateral stabily of the vehicle.
 Report Generator Customization
With the latest update of the report generator, MXeval can customize the entire report output of your evaluation results. By customizing colors and logos, MXeval now fits seamlessly into your corporate design.
 Custom Tests
With the new Custom Test feature, MXeval is now capable to fully adapt to your evaluation needs. This feature enables the integration of your in-house evaluations with just a few clicks, using the existing internal configuration infrastructure.
 Visualization Subplots
Being able to create generic subplot layouts of the existing visualization plots, MXeval provides another option for data exploration and validation. Different plots can now be compared next to each other providing more direct feedback of the evaluation results.
 GPS Visualization Plots
Using the Google Maps platform, MXeval is now able to provide accurate map data in a combination with your measurement data. This allows to get a better understanding of the data due to the instant visual feedback to the user.
 Heatmap Visualization Plots
The new visualization heatmap adds a third data dimension to any plot in a generic way. This visualization feature makes it easy to analyze data coherences and behaviors. In combination with the new GPS plots, this considerably expands the visualization capabilities of MXeval.
MXeval 4.0 is another milestone for software development at MdynamiX AG, all these features have been developed to meet user requirements. Do you have any requests for MXeval? Get in touch with us!
Release Notes
Feature Updates
- GUI enhancements
- New observer trigger modes for unlocked files
- Root configuration merge when updating MXeval
- Installer files now for x64 architectures only
- Report generator automatically stores last output directory
- Added scatter plot type to custom plots
- Updated channel IDs
- Added custom channel configuration function to call MATLAB COM server